
Mastering the art of crypto chart analysis is crucial for navigating the volatile world of cryptocurrency trading. This guide will equip you with the knowledge to decipher complex market trends, identify promising investment opportunities, and ultimately, predict price movements. Learn how to interpret key indicators like moving averages, RSI, and MACD, and understand the significance of support and resistance levels, candlestick patterns, and volume analysis. Unlock the secrets to successful crypto trading with our comprehensive walkthrough of technical analysis.
What is Technical Analysis in Crypto?
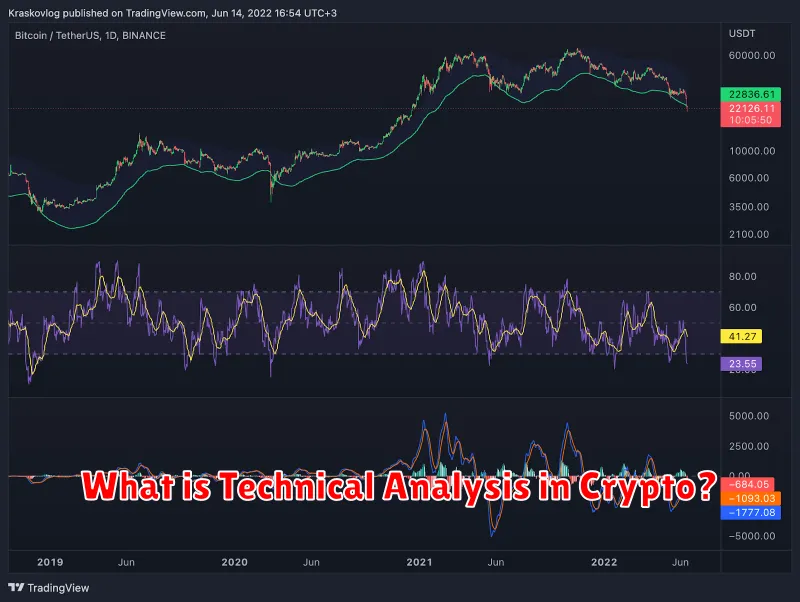
Technical analysis in crypto is the process of examining past market data, such as price and volume, to identify potential future price movements. It differs from fundamental analysis, which focuses on the underlying technology or project. Instead, technical analysts use charts and various indicators to predict trends.
The core belief is that market history repeats itself, meaning past price patterns can offer clues about future direction. This involves studying candlestick patterns, trendlines, support and resistance levels, and various technical indicators like moving averages and relative strength index (RSI).
While technical analysis is a valuable tool, it’s crucial to remember it’s not foolproof. Market sentiment and unexpected events can significantly impact prices, rendering even the most accurate predictions unreliable. Therefore, using technical analysis in conjunction with other forms of research and risk management is vital for successful cryptocurrency trading.
Understanding Candlestick Patterns
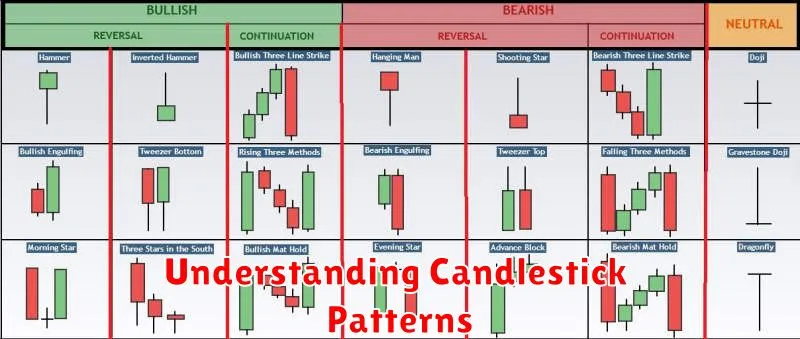
Candlestick patterns are a visual representation of price movements over a specific period, providing valuable insights into market sentiment and potential future trends. Each candlestick represents the open, high, low, and close prices of an asset during that time frame.
Bullish patterns suggest a potential price increase. Examples include the hammer, which shows a significant price drop followed by a strong close near the high, and the engulfing pattern, where a large candlestick completely encompasses a preceding smaller one.
Conversely, bearish patterns signal potential price declines. The hanging man, similar to the hammer but appearing at the top of an uptrend, and the dark cloud cover, characterized by a large bearish candle following a bullish one, are common examples.
Interpreting candlestick patterns requires considering the context. Isolated patterns offer limited predictive power; combining them with other technical indicators and broader market analysis provides a more accurate assessment of potential price movements. It’s crucial to remember that candlestick patterns are not foolproof predictors, but rather tools to aid in informed decision-making.
Using Moving Averages for Trend Prediction
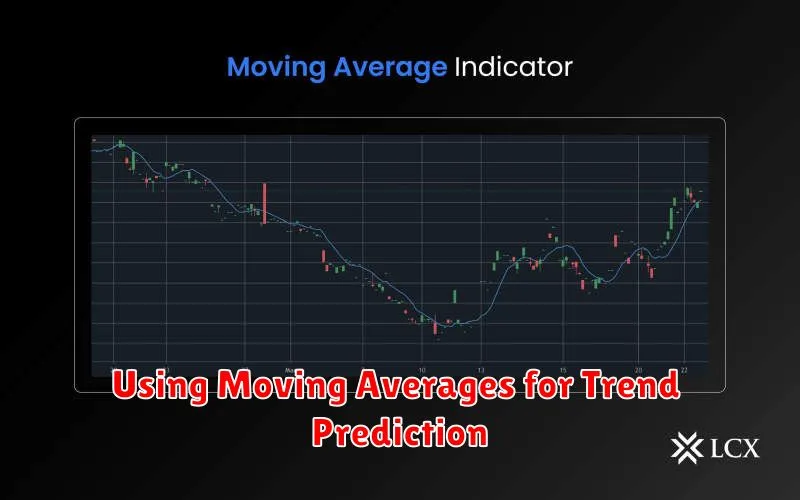
Moving averages are crucial tools for identifying trends in cryptocurrency markets. They smooth out price fluctuations, revealing the underlying direction. Different types of moving averages, such as simple moving averages (SMA) and exponential moving averages (EMA), offer varying levels of responsiveness to recent price changes.
SMAs calculate the average price over a specific period (e.g., 50 days, 200 days). They are simple to understand but can lag behind sharp market turns. EMAs give more weight to recent prices, making them more reactive to short-term price changes. Traders often use multiple moving averages together; for example, a shorter-term EMA crossing above a longer-term SMA can signal a buy signal, while the opposite suggests a sell signal.
The selection of appropriate periods for moving averages depends on the trading timeframe and individual investor’s risk tolerance. Longer periods provide a smoother trend line but are less sensitive to short-term fluctuations. Shorter periods offer greater responsiveness but may produce more false signals. Analyzing the relationship between different moving averages, combined with other technical indicators, helps improve prediction accuracy.
It’s important to remember that moving averages are not foolproof predictors. They are just one piece of the puzzle in technical analysis. Market sentiment, news events, and other factors can all significantly impact price movements. Using moving averages effectively requires practice and an understanding of their limitations.
How to Read RSI and MACD Indicators
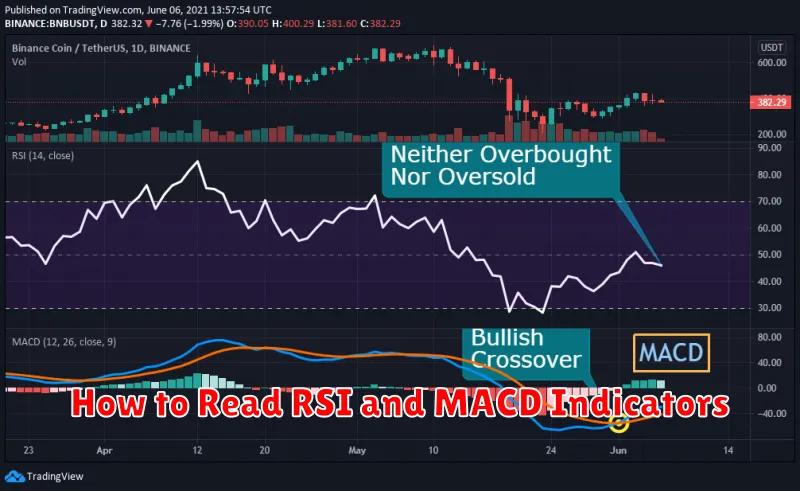
The Relative Strength Index (RSI) and Moving Average Convergence Divergence (MACD) are popular technical indicators used to analyze momentum and potential trend reversals in cryptocurrency markets. Understanding them can improve your chart reading skills.
The RSI measures the magnitude of recent price changes to evaluate overbought or oversold conditions. Values above 70 generally suggest an overbought market (potential sell signal), while values below 30 indicate an oversold market (potential buy signal). However, it’s crucial to note that these levels are not absolute and can vary.
The MACD is a trend-following momentum indicator showing the relationship between two moving averages of a security’s price. It consists of a MACD line (difference between the two moving averages) and a signal line (moving average of the MACD line). Bullish signals often occur when the MACD line crosses above the signal line, suggesting a potential uptrend. Conversely, a bearish signal arises when the MACD line crosses below the signal line, suggesting a potential downtrend. Divergence between the MACD and price action can also be a significant indicator.
It’s important to remember that neither RSI nor MACD is a foolproof predictor. They are best used in conjunction with other technical indicators and fundamental analysis for a more comprehensive market assessment. Always consider risk management before making any trading decisions.
How News Affects Crypto Markets

Crypto markets are highly sensitive to news. Positive news, such as regulatory approvals, successful product launches, or partnerships with major companies, can lead to a significant price increase (bullish sentiment). Investors perceive these events as positive catalysts for future growth.
Conversely, negative news, including security breaches, regulatory crackdowns, or prominent figure criticisms, often results in a sharp price decrease (bearish sentiment). Fear, uncertainty, and doubt (FUD) quickly spread through the market, impacting investor confidence and leading to sell-offs.
The impact of news on crypto prices can be immediate and dramatic. Market reactions can be amplified by the 24/7 nature of crypto trading and the high degree of leverage employed by some investors. Therefore, staying informed about relevant news is crucial for navigating the volatile nature of crypto markets.
Analyzing news requires critical evaluation. Not all news is created equal. Consider the source’s credibility, potential biases, and the overall context of the information before drawing conclusions. Differentiating between market-moving news and noise is a key skill for successful crypto investing.
Avoiding Emotional Trading
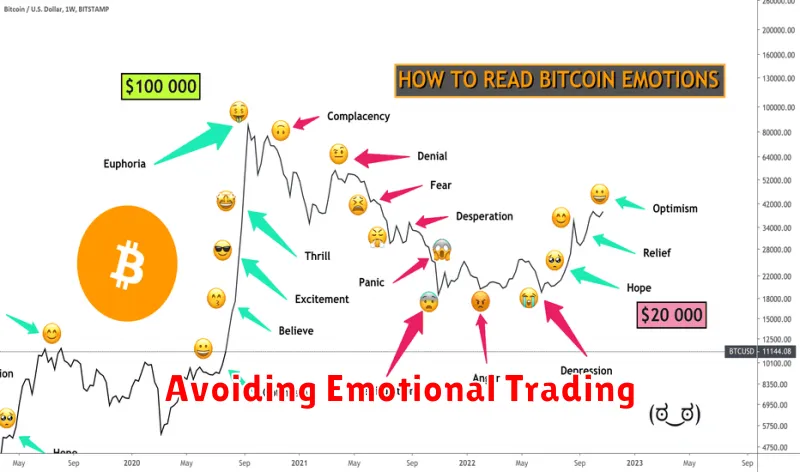
Successful crypto investing relies heavily on objective analysis, not emotional reactions. Fear and greed are powerful forces that can lead to impulsive, often disastrous, decisions.
Fear can cause you to sell during market dips, locking in losses, while greed might tempt you to buy at inflated prices, potentially leading to significant losses. These emotions cloud judgment, preventing you from making rational, data-driven choices.
To mitigate emotional trading, establish a well-defined trading plan before entering the market. This plan should outline your investment strategy, risk tolerance, and clear entry and exit points based on technical indicators and market analysis, not gut feelings.
Sticking to your plan is crucial. Discipline is key. Avoid checking charts constantly; set specific times for analysis to prevent impulsive reactions to short-term price fluctuations. Regularly review your portfolio but refrain from making frequent, emotion-driven adjustments.
Consider using stop-loss orders to automatically sell assets if they reach a predetermined price point, limiting potential losses. This helps prevent panic selling during market downturns. Furthermore, maintaining a long-term perspective and focusing on the overall market trend can reduce the impact of short-term volatility and emotional decision-making.
Remember, consistent self-reflection and learning from past trading mistakes are vital components of improving your emotional control and overall trading success.